Monitoring
Monitoring is essential for proactively identifying and addressing system issues, ensuring performance, and maintaining overall reliability with minimal manual intervention.
Access Monitoring Tab
-
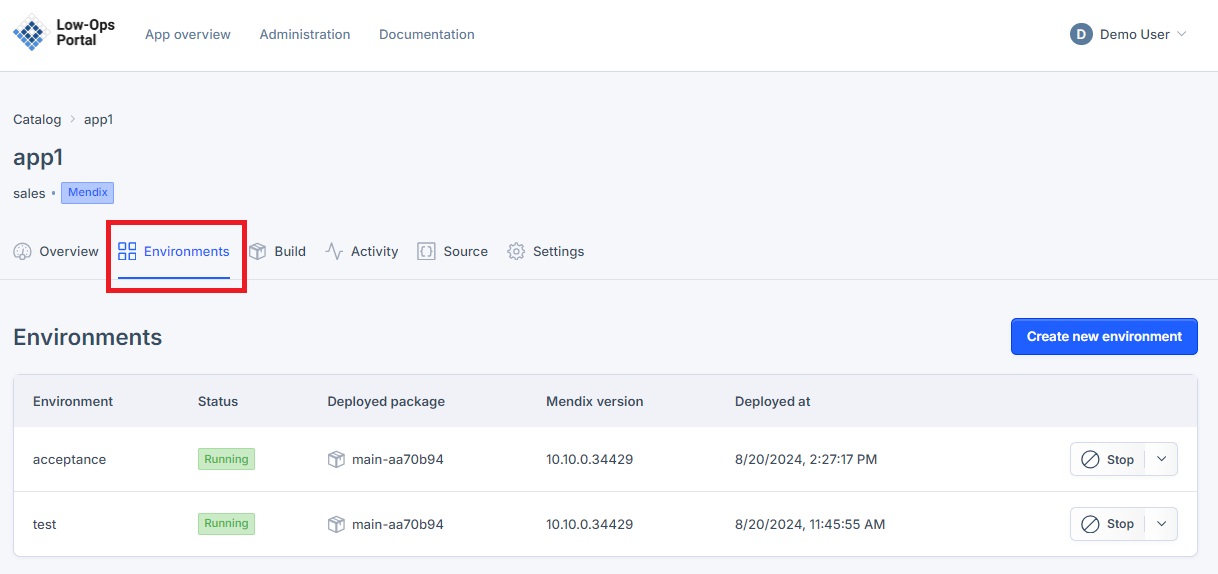
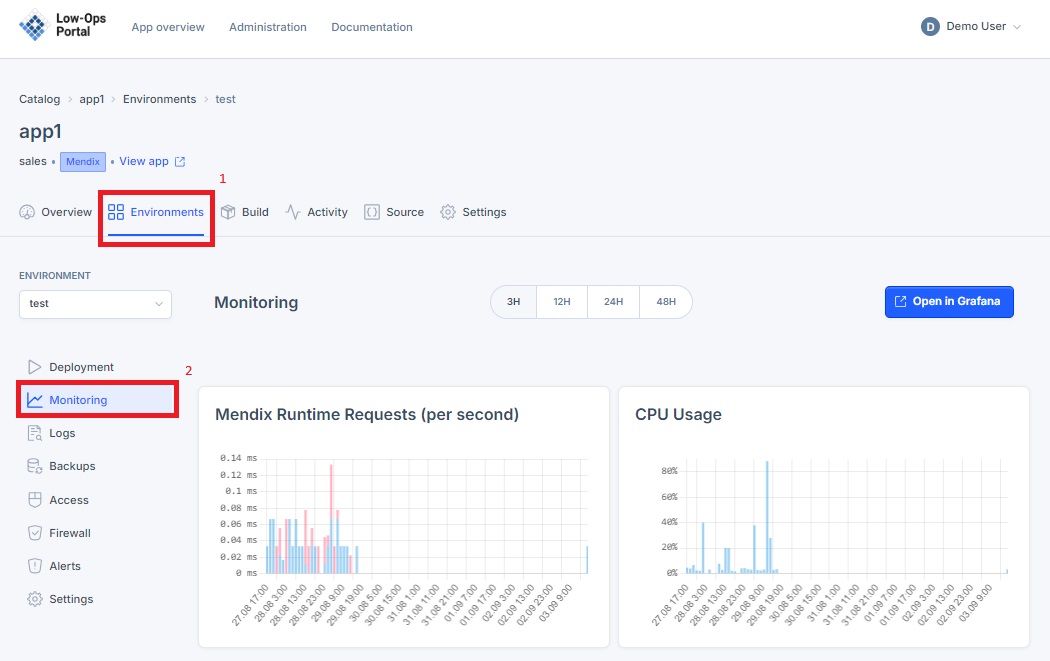
Navigate to the "Environments" tab.

-
Choose the desired environment from the list.
- A new dropdown navigation menu will appear.
-
In the left-side menu, select "Monitoring".

Managing Monitoring tab
<img src="../../../assets/images/managing_monitoring.jpg" width="500" alt="Managing monitoring">
-
Select the period for which to display the metrics: "3H", "12H", "24H", or "48H".
-
Click the "Open in Grafana" button to access more metrics.
Available Metrics
Mendix Runtime Requests (per second)
<img src="../../../assets/images/runtime_requests.jpg" width="300" alt="Runtime Requests">
This metric shows the number of requests processed by the Mendix Runtime per second.
CPU Usage
<img src="../../../assets/images/CPU_usage.jpg" width="300" alt="CPU Usage">
This metric displays the percentage of CPU utilization by the Mendix application.
JVM Memory Usage
<img src="../../../assets/images/JVM_memory_usage.jpg" width="300" alt="JVM Memory Usage">
This metric shows the amount of Java Virtual Machine (JVM) memory used by the application.
Mendix Connection Bus
<img src="../../../assets/images/connection_bus.jpg" width="300" alt="Connection Bus">
This metric displays the status and performance of the Mendix Connection Bus.
Microflow Metrics - Mendix Microflow Execution Frequency
This metric displays Mendix Microflow Execution Frequency (per second).
<img src="../../../assets/images/execution_frequency.jpg" width="300" alt="Execution Frequency">
Microflow Metrics - Mendix Microflow Execution Time
This metric displays Mendix Microflow Execution Time.
<img src="../../../assets/images/execution_time.jpg" width="300" alt="Execution Time">
Datadog support
Datadog is a monitoring service that allows you to monitor your application performance and troubleshoot issues.
Set following environment variables in the Mendix application environment:
DD_API_KEY=api-key
DD_HOSTNAME=hostname
DD_SITE=datadoghq.eu
Where:
DD_API_KEYis the API key for the Datadog service.DD_HOSTNAMEis the hostname of the Mendix application.DD_SITEis the Datadog site to use.