Monitoring
Monitoring is essential for proactively identifying and addressing system issues, ensuring performance, and
maintaining overall reliability with minimal manual intervention.
In Low-Ops each environment is monitored separately and you can access the monitoring by navigating to
Application > Environment > Monitoring. Select the period for which to display the metrics, default is last 3 hours.
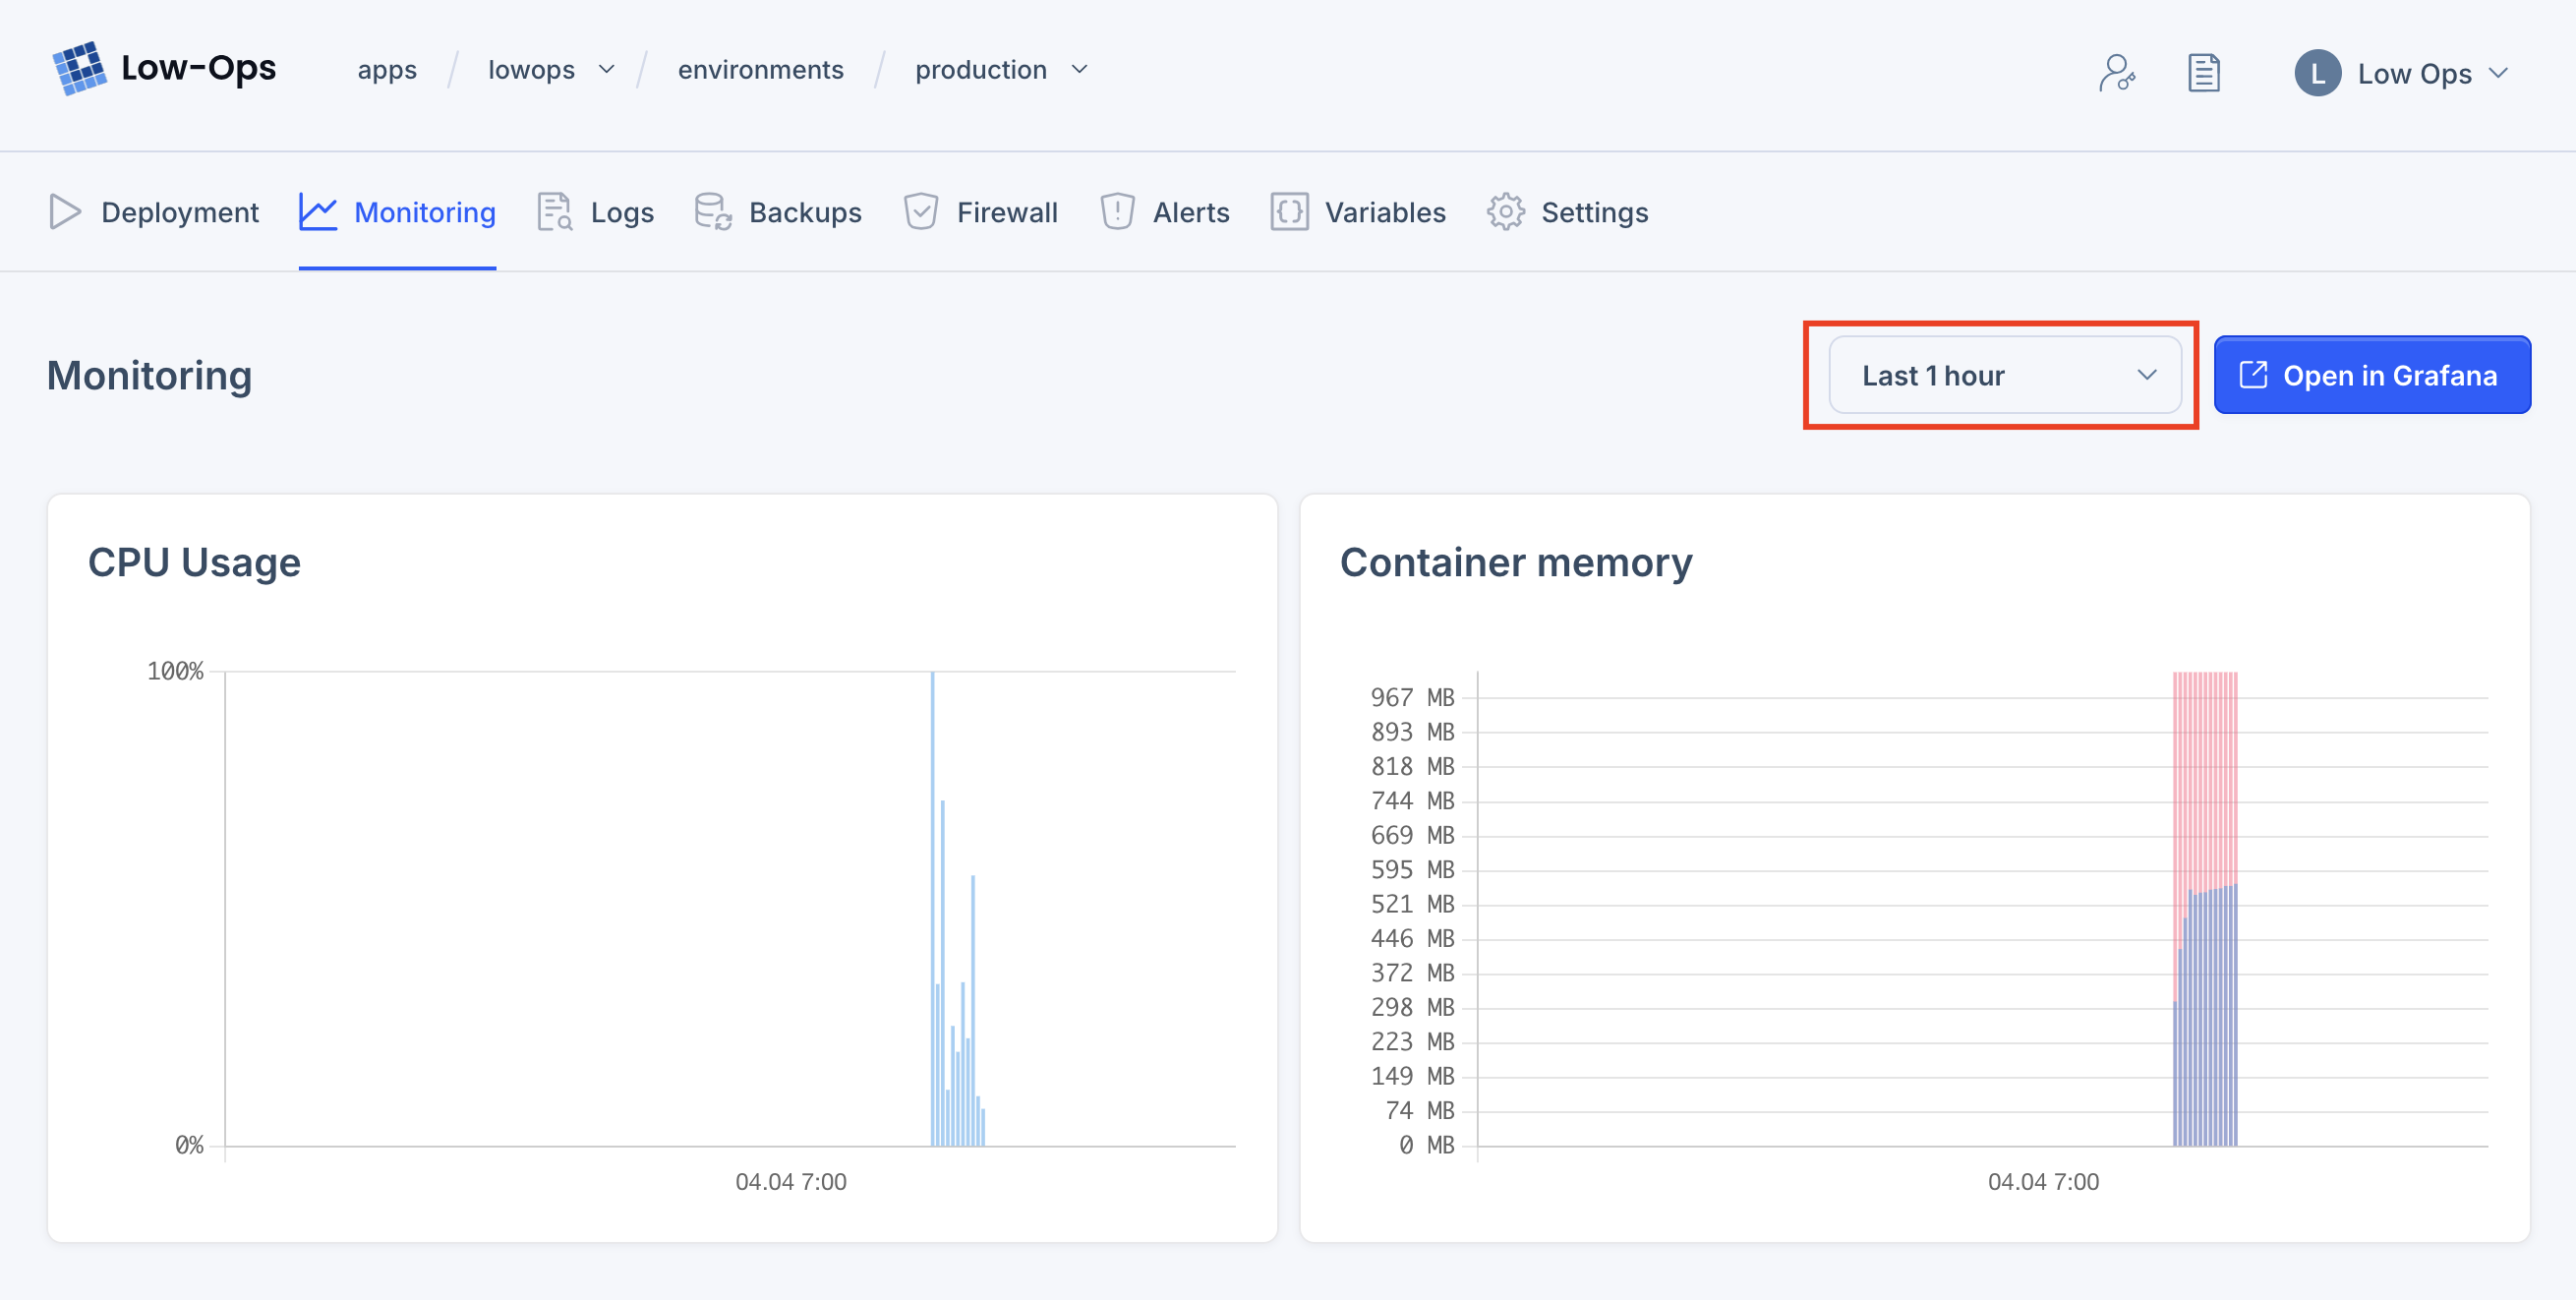
For more metrics you can go to the Grafana dashboard by clicking on the Open in Grafana button.
Available Metrics
- Generic Application
- Mendix Application
CPU Usage
Displays the percentage of CPU utilization by the application.
Memory Usage
Displays the amount of memory used by the application.
CPU Usage
Displays the percentage of CPU utilization by the application.
Memory Usage
Displays the amount of memory used by the application.
Mendix Runtime Requests (per second)
Displays the number of requests processed by the Mendix Runtime per second.
JVM Memory Usage
Displays the number of Mendix Runtime sessions.
Mendix Connection Bus
Displays the status and performance of the Mendix Connection Bus.
Microflow Metrics - Mendix Microflow Execution Frequency
Displays Mendix Microflow Execution Frequency (per second).
Microflow Metrics - Mendix Microflow Execution Time
Displays Mendix Microflow Execution Time..
Datadog Support
Datadog is a monitoring service that allows you to monitor your application performance and troubleshoot issues.
Set following environment variables in the application environment
  DD_API_KEY=api-key
  DD_HOSTNAME=hostname
  DD_SITE=datadoghq.eu
DD_HOSTNAMEis the hostname of the Mendix application.DD_API_KEYis the API key for the Datadog service.DD_SITEis the Datadog site to use.